
In today’s data-driven marketing landscape, leveraging the right analytics tools is paramount to success. Marketing analytics provide invaluable insights into campaign performance, customer behavior, and overall return on investment (ROI). For marketers seeking to optimize their strategies, understanding which analytics tools are available and how to use them effectively is essential. This article explores the essential analytics tools every marketer should know, encompassing a range of platforms and techniques designed to enhance campaign effectiveness and drive marketing success. From website analytics to social media listening and marketing automation, mastering these tools is crucial for staying competitive in the modern marketing world.
Whether you’re a seasoned marketing professional or just starting your career, having a strong grasp of analytics tools is no longer optional, it’s a necessity. This article provides a comprehensive overview of the most impactful analytics tools available, empowering marketers to make data-driven decisions, track key performance indicators (KPIs), and ultimately achieve their marketing objectives. By understanding the capabilities of these analytics tools and how they can be integrated into existing marketing strategies, professionals can unlock valuable insights, optimize campaigns in real-time, and gain a competitive edge in the ever-evolving marketing landscape.
Why Analytics Is Essential in Marketing
In today’s data-driven world, marketing relies heavily on analytics to understand customer behavior, measure campaign effectiveness, and optimize return on investment (ROI). Analytics provides marketers with the insights necessary to make informed decisions, rather than relying on guesswork or intuition.
By analyzing data from various sources, such as website traffic, social media engagement, and email campaigns, marketers can identify trends, patterns, and correlations that reveal valuable information about their target audience. This information can be used to personalize marketing messages, target specific customer segments, and improve the overall customer experience.
Furthermore, analytics enables marketers to track the performance of their marketing campaigns in real-time. By monitoring key metrics like click-through rates, conversion rates, and cost per acquisition, marketers can identify which campaigns are performing well and which need adjustments. This allows for agile marketing strategies and ensures that resources are allocated effectively.
Ultimately, analytics empowers marketers to demonstrate the value of their efforts by providing concrete data on the impact of marketing activities on business objectives. This data-driven approach allows for continuous improvement and helps organizations achieve their marketing goals more efficiently.
Top Free vs Paid Analytics Platforms
Choosing between free and paid analytics platforms depends heavily on your specific needs and budget. Free tools offer basic insights, while paid options unlock more advanced features and deeper analysis.
Free platforms like Google Analytics offer robust tracking of website traffic, user behavior, and conversions. They are excellent starting points for businesses looking to understand their online presence. However, free tools often have limitations in data customization, reporting depth, and customer support.
Paid analytics platforms provide more comprehensive features, including advanced segmentation, predictive analytics, and custom reporting. These tools offer greater flexibility in data analysis and are often better suited for larger businesses or those with complex data needs.
Here’s a simple comparison:
| Feature | Free | Paid |
|---|---|---|
| Basic Traffic Tracking | Yes | Yes |
| Advanced Segmentation | Limited | Extensive |
| Custom Reporting | Limited | Extensive |
| Predictive Analytics | No | Often Included |
| Dedicated Support | Limited | Yes |
Ultimately, the best platform for you depends on your business goals and resources.
Google Analytics 4 Basics
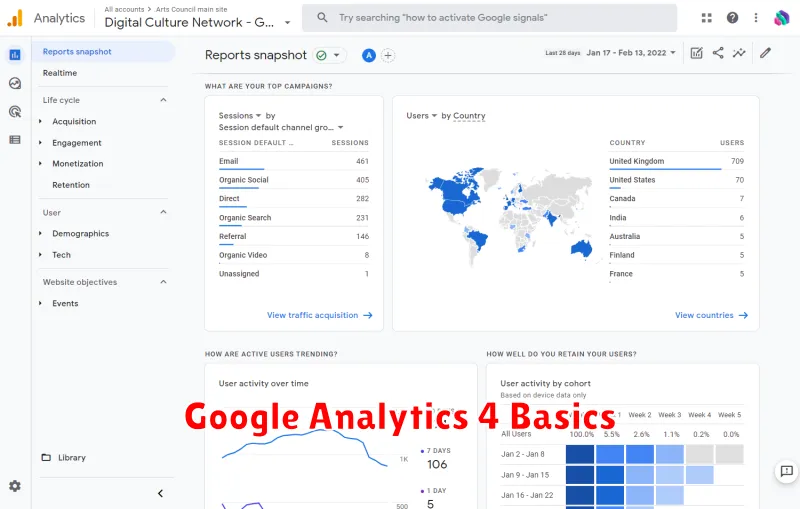
Google Analytics 4 (GA4) is the latest iteration of Google’s web analytics platform. It’s crucial for marketers seeking to understand user behavior across websites and apps. GA4 differs significantly from its predecessor, Universal Analytics (UA). It utilizes an event-based data model, moving away from the session-based model of UA.
This event-based model allows for more flexible and granular data collection. Every interaction, from page views to button clicks, is tracked as an event. This shift enables a more comprehensive view of the customer journey.
Key features of GA4 include enhanced cross-platform tracking, machine learning powered insights, and a greater focus on privacy. Cross-platform tracking allows you to consolidate data from websites and apps into a single property, providing a holistic view of user engagement.
GA4 uses machine learning to fill data gaps caused by cookie restrictions and provides predictive metrics like churn probability and potential revenue. These insights help marketers anticipate user behavior and optimize campaigns proactively.
Understanding Key Metrics (CTR, Bounce Rate, etc.)
Analyzing marketing campaign performance relies heavily on understanding key metrics. These metrics provide valuable insights into user behavior and campaign effectiveness.
Click-Through Rate (CTR) measures the percentage of users who click on a link after seeing it. A high CTR generally indicates a successful ad or engaging content. Bounce Rate represents the percentage of visitors who leave a website after viewing only one page. A high bounce rate might suggest issues with site design, content relevance, or user experience.
Conversion Rate tracks the percentage of visitors who complete a desired action, such as making a purchase or filling out a form. This metric is crucial for assessing the overall success of a campaign. Average Session Duration indicates the average time users spend on a website. Longer durations often correlate with higher engagement levels.
Other important metrics include Cost Per Acquisition (CPA), which measures the cost of acquiring a new customer, and Return on Investment (ROI), which evaluates the profitability of a marketing campaign.
Attribution Models Explained
Attribution models are the rules, or set of rules, that determine how credit for sales and conversions is assigned to touchpoints in conversion paths. Understanding how different models work is crucial for marketers to effectively analyze marketing performance and optimize campaigns.
Several common attribution models exist, each with its own approach. The Last Click model gives 100% of the credit to the final touchpoint before the conversion. While simple, it ignores the influence of earlier touchpoints. Conversely, the First Click model assigns all credit to the initial touchpoint. The Linear model distributes credit evenly across all touchpoints in the conversion path. Time decay gives more credit to touchpoints closer to the conversion, acknowledging the increasing influence as the customer moves down the funnel. More complex models, like position-based and data-driven models, allocate credit based on predetermined weights or algorithmic calculations respectively.
Choosing the right attribution model depends on the specific business and marketing objectives. Consider the customer journey, the length of the sales cycle, and the role of different marketing channels in influencing conversions.
Real-Time vs Historical Data
Understanding the difference between real-time and historical data is crucial for effective marketing analysis. Real-time data refers to information that is captured and processed immediately, providing an up-to-the-second view of events. This type of data is valuable for monitoring current campaigns, tracking website traffic, and responding to immediate trends.
Historical data, conversely, encompasses collected information from the past. It provides context and allows marketers to identify long-term patterns, seasonality, and the overall performance of past campaigns. Analyzing historical data helps in making informed decisions for future strategies and predicting potential outcomes.
Both real-time and historical data play essential roles in a comprehensive marketing analytics strategy. While real-time data provides immediate insights for quick adjustments, historical data offers a broader perspective for long-term planning and strategic decision-making.
Setting Up Goals and Events
Goals and events are crucial for measuring the effectiveness of your marketing campaigns. Goals represent the desired outcomes you want to achieve, such as a purchase, form submission, or a specific page view. Events, on the other hand, track user interactions with your website or app, providing granular insights into user behavior. By configuring goals and events correctly, you gain a clearer understanding of what’s working and what needs improvement.
Setting up goals typically involves defining the goal type and specifying the criteria that signify its completion. For instance, a “destination” goal might be triggered when a user reaches the thank-you page after a purchase. An “event” goal, conversely, would be triggered by a specific user action, like clicking a particular button or playing a video.
Events are often categorized based on their purpose. Common event categories include clicks, downloads, video plays, and form submissions. It’s important to choose descriptive event names and parameters to facilitate accurate analysis and reporting. This detailed tracking allows for precise measurement of user engagement and helps pinpoint areas for optimization.
Custom Dashboards and Reporting
Custom dashboards are essential for marketers seeking to gain a comprehensive understanding of their campaigns and overall marketing performance. They allow for the visualization of key performance indicators (KPIs) in a way that is tailored to specific business needs.
Instead of sifting through pre-built reports, marketers can select the metrics that matter most and display them in an easily digestible format. This could include metrics such as website traffic, conversion rates, customer acquisition cost (CAC), and return on ad spend (ROAS).
Custom reporting further enhances this by enabling marketers to create specific reports based on the data gathered in their custom dashboards. This functionality allows for in-depth analysis of particular campaigns or marketing channels, providing actionable insights for optimization.
Through custom dashboards and reporting, marketers can effectively monitor their progress, identify areas for improvement, and ultimately make data-driven decisions to maximize their marketing ROI.
Common Data Mistakes to Avoid
Data analysis is crucial for effective marketing. However, inaccurate data can lead to flawed strategies and wasted resources. Avoiding common data mistakes is paramount to success. One frequent error is inconsistent data collection. Standardized processes and clear definitions are vital for maintaining data integrity across different sources and platforms.
Another pitfall is failing to clean and validate data. This can include overlooking duplicate entries, missing values, and inconsistencies in formatting. Implementing data quality checks and cleansing procedures can help prevent these issues. Additionally, misinterpreting data can lead to incorrect conclusions. Understanding the context of the data and employing appropriate analytical methods are essential for drawing accurate insights.
Ignoring statistical significance is another common mistake. Marketers must be cautious about drawing conclusions from small sample sizes or failing to account for statistical variability. Finally, not segmenting your data sufficiently can obscure valuable insights. Segmenting data by demographics, behavior, and other relevant factors can reveal trends and patterns that would otherwise be missed.
Actionable Insights from Analytics
Analytics tools provide more than just vanity metrics. They offer actionable insights that can significantly impact marketing strategies. Analyzing data reveals trends, patterns, and user behavior, allowing marketers to make informed decisions.
For instance, identifying high-performing content allows for optimized content creation. Understanding audience demographics enables targeted advertising, maximizing reach and engagement. Analyzing website traffic patterns can lead to improved user experience (UX) and increased conversions.
A/B testing, driven by analytics, helps refine marketing campaigns by comparing different versions and identifying the most effective approach. This data-driven optimization leads to better return on investment (ROI) and overall campaign success.
Analyzing customer journey data, such as time spent on pages and conversion funnels, allows for personalized marketing strategies and improved customer retention. This in turn drives customer lifetime value (CLTV).